How to create a custom report dashboard in Pure Workflow
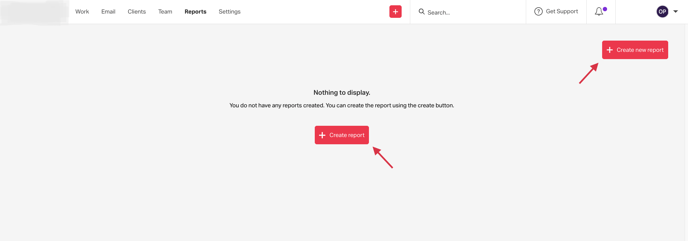
To create a new report dashboard in Pure Workflow, first open the Reports tab at the top of your workspace, and then select the Create report button.
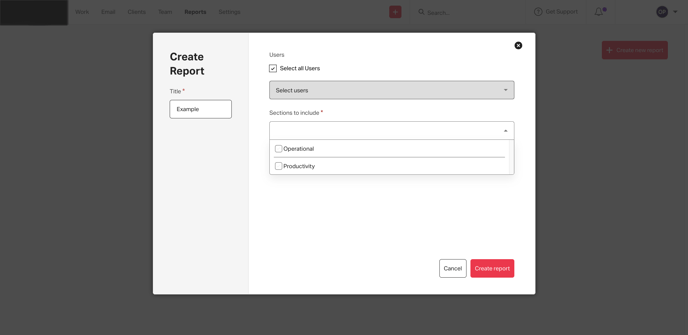
This will open a popup window where you can create a name for this new report, and choose the team members and data sets you would like to include. When you're happy with this, select Create Report.
Please note: If neither Operational nor Productivity sections are selected when creating a report, this will contain only the email reporting metrics by default.
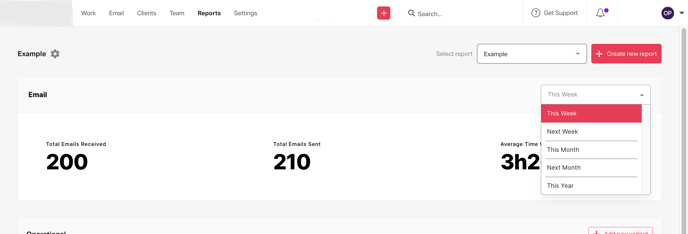
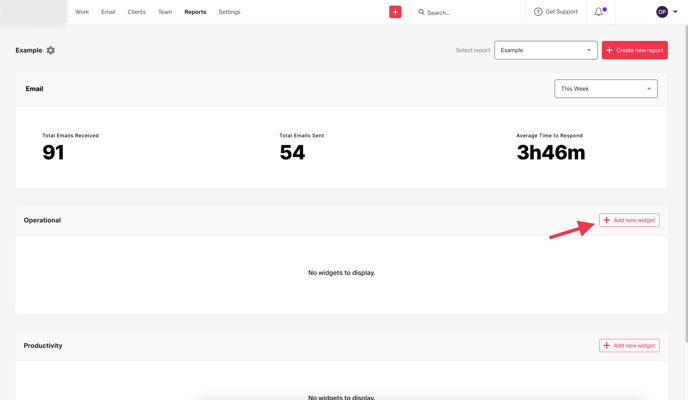
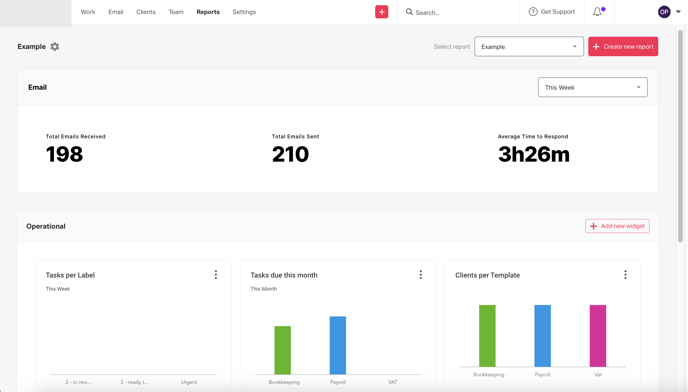
Once you've created a report, the first thing see you will on this page is the emails section at the top; we can change the time frame for this section using the dropdown in the top right-hand corner.
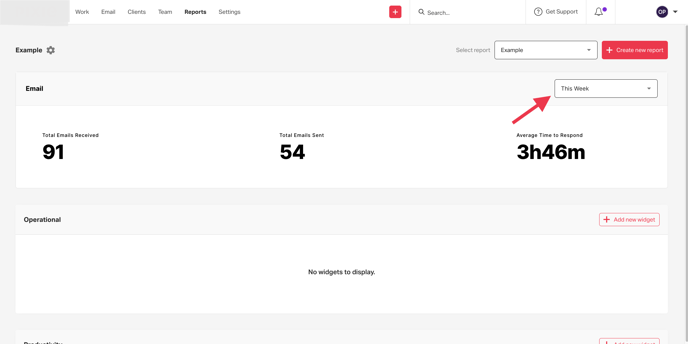
If you selected to add the Productivity and/or Operational sections to this report and'd like to add a widget to see these data points, you can do this by clicking the Add new widget button to the right of the section header.
Next, create a name for this widget, select the metric you'd like to add a widget for and customise the Time frame, Templates, Clients and/or Labels you'd like to be included where applicable.
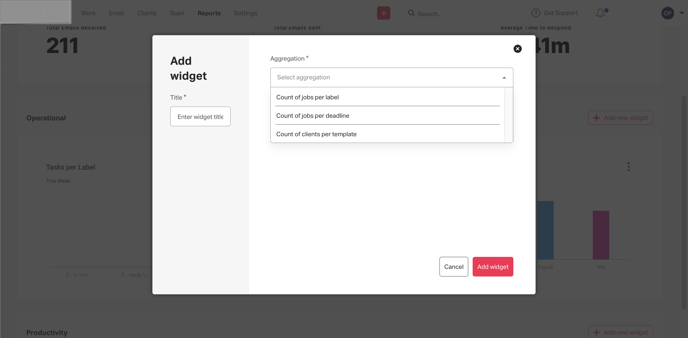
When you're ready, select the Add widget button, and this widget will have been added to the report you have created.
Please see below for a list of the available metrics:
Emails:
- The total emails received over a certain time frame
- The total emails sent over a certain time frame
- The average time taken to respond across a certain time frame
Productivity:
- The number of tasks completed over a certain time frame
- How many clients a team member is the client manager for
Operational:
- The number of tasks created per label over a certain time frame
- The number of tasks created based on the deadline of the task over a certain time frame
- The number of clients a task has been created for using a specific template/s over a certain time frame